Looking for the most current electricity rates in Canada? Compare residential electricity prices across all Canadian provinces and territories as of July 2026. Understanding your local electricity costs is essential for evaluating solar power investments, budgeting monthly expenses, and determining potential energy savings.
Electricity rates in Canada vary dramatically—from Quebec's 8.3¢/kWh (one of the lowest in North America) to Northwest Territories' rates of roughly 25.0¢–34.0¢/kWh (up to 4× higher). This comprehensive guide breaks down rates by province, explains why prices differ so dramatically, and helps you calculate potential solar savings based on your location.
💡 Key Insight: If you're paying more than 18¢/kWh, solar panels typically pay for themselves in 8-12 years. Provinces like Alberta (22.9¢), Prince Edward Island (19.7¢), Nova Scotia (19.1¢), and northern territories like Yukon (18.0¢–24.0¢) see some of the fastest solar ROI in North America.
⚡ At a Glance: Province Comparison
Lowest Rates (Best for keeping electricity costs down):
- 🥇 Quebec: 8.3¢/kWh - Abundant hydro power
- 🥈 Manitoba: 10.6¢/kWh - Hydroelectric dominance
- 🥉 British Columbia: 10.97¢/kWh (BC Hydro Step 1) - Clean hydro energy
Highest Rates (Best for solar ROI):
- 🔴 Northwest Territories: 25.0¢–34.0¢/kWh - Diesel generation
- 🔴 Yukon Territory: 18.0¢–24.0¢/kWh - Mostly hydro, with diesel/LNG backup
- 🔴 Nunavut: 35.4¢/kWh - Remote diesel reliance
- 🔴 Alberta: 22.9¢/kWh - Market-based pricing
Current Electricity Rates by Province (July 2026)
Compare the most recent average residential electricity rates across Canadian provinces and territories. These rates include energy charges, delivery costs, and standard fixed fees (before taxes). Data reflects the latest regulatory filings and published tariffs as of July 2026.
| Province/Territory | Rate (¢/kWh) | Rate Details | Source / Notes |
|---|---|---|---|
| Quebec | 8.3¢ | Tiered rate average | Hydro-Québec - Canada's lowest rates |
| Manitoba | 10.6¢ | Standard residential | Manitoba Hydro — 4% increase effective January 1, 2026 |
| British Columbia | 10.97¢ | BC Hydro: 10.97¢ (Step 1), 14.08¢ (Step 2), 12.63¢ (flat option); FortisBC: ~15.80¢ | BCUC approved rates — 2026 framework |
| New Brunswick | 15.4¢ | Standard residential rate, effective April 14, 2026, plus annual VAR surcharge | NB Power — rate effective April 14, 2026 |
| Ontario | 17.0¢ | Blended estimate, TOU/tiered pricing | OEB Regulated Price Plan, effective Nov 1, 2025 (commodity cost +29%), plus delivery |
| Newfoundland & Labrador | 15.8¢ | Blended average | NL Hydro/Newfoundland Power framework |
| Nova Scotia | 19.1¢ | Energy rate, effective May 1, 2026 | NS Power (19.128¢/kWh energy + $20.08/month base charge) |
| Prince Edward Island | 19.7¢ | Tiered residential, blended | Maritime Electric / IRAC — no general rate increase filed for 2026 |
| Yukon | 18.0¢–24.0¢ | Tiered blocks, blended for typical usage | Yukon Energy / ATCO Electric Yukon — riders already included in published base rate |
| Saskatchewan | 18.6¢ | Blended (energy rate + basic charge) | SaskPower — 15.476¢/kWh + $31.16/month basic charge, effective Feb 1, 2026 |
| Alberta | 22.9¢ | Blended (RoLR commodity + delivery) | Regulated Rate Option (~12.0¢/kWh commodity, fixed through Dec 2026) + distribution/transmission |
| Nunavut | 35.4¢ | Includes subsidies | Qulliq Energy Corp., diesel generation |
| Northwest Territories | 25.0¢–34.0¢ | Highest in Canada, after subsidy | NTPC/Naka Power, diesel & hydro mix; Territorial Power Support Program subsidizes the first ~1,000 kWh/month in winter |
Color coding: Green = Under 12¢/kWh (Low), Yellow = 15-20¢/kWh (Moderate-High), Red = Over 20¢/kWh (Very High - Excellent for solar)
Note on New Brunswick: NB Power uses a two-tier rate structure plus an annual Variance Account Recovery (VAR) surcharge that adjusts for unplanned cost variances. Actual bills are typically higher than the base rate shown.
Note on Yukon: Rider J (Yukon Energy) and Rider R (ATCO Electric Yukon) are now folded directly into the published base rate (as of December 2024), rather than sitting on top of it as a separate surcharge. Current published residential energy charges run roughly 20.8¢/kWh for the first 1,000 kWh/month and 25.5¢/kWh above that, which blends to about 18.0¢–24.0¢/kWh for typical monthly usage.
Note on Northwest Territories & Nunavut: Published sticker rates in remote NWT zones can run well above 30¢/kWh before subsidy, and above 60¢/kWh in parts of Nunavut. Both territories subsidize a portion of monthly usage (the NWT's Territorial Power Support Program and Nunavut's Electricity Subsidy Program), which brings typical effective residential rates down into the ranges shown above.
💡 Quick Recommendation: Want to find out exactly how much power your individual appliances are wasting? A Watt Meter Power Meter Plug Home Electricity Usage Monitor lets you track consumption, voltage, and amps with an easy-to-read backlit display so you can pinpoint your biggest energy drains before upgrading to solar.
Solar panels could pay for themselves in 6–12 years at your rate.
Find out how many panels you need based on your monthly electricity bill — takes 30 seconds.
How Many Solar Panels Do I Need? → Calculate My Solar ROI →Electricity Cost Highlights – July 2026
Residential electricity prices in Canada vary dramatically based on location, utility structure, and energy generation sources. These price differences create varying opportunities for solar energy savings across the country.
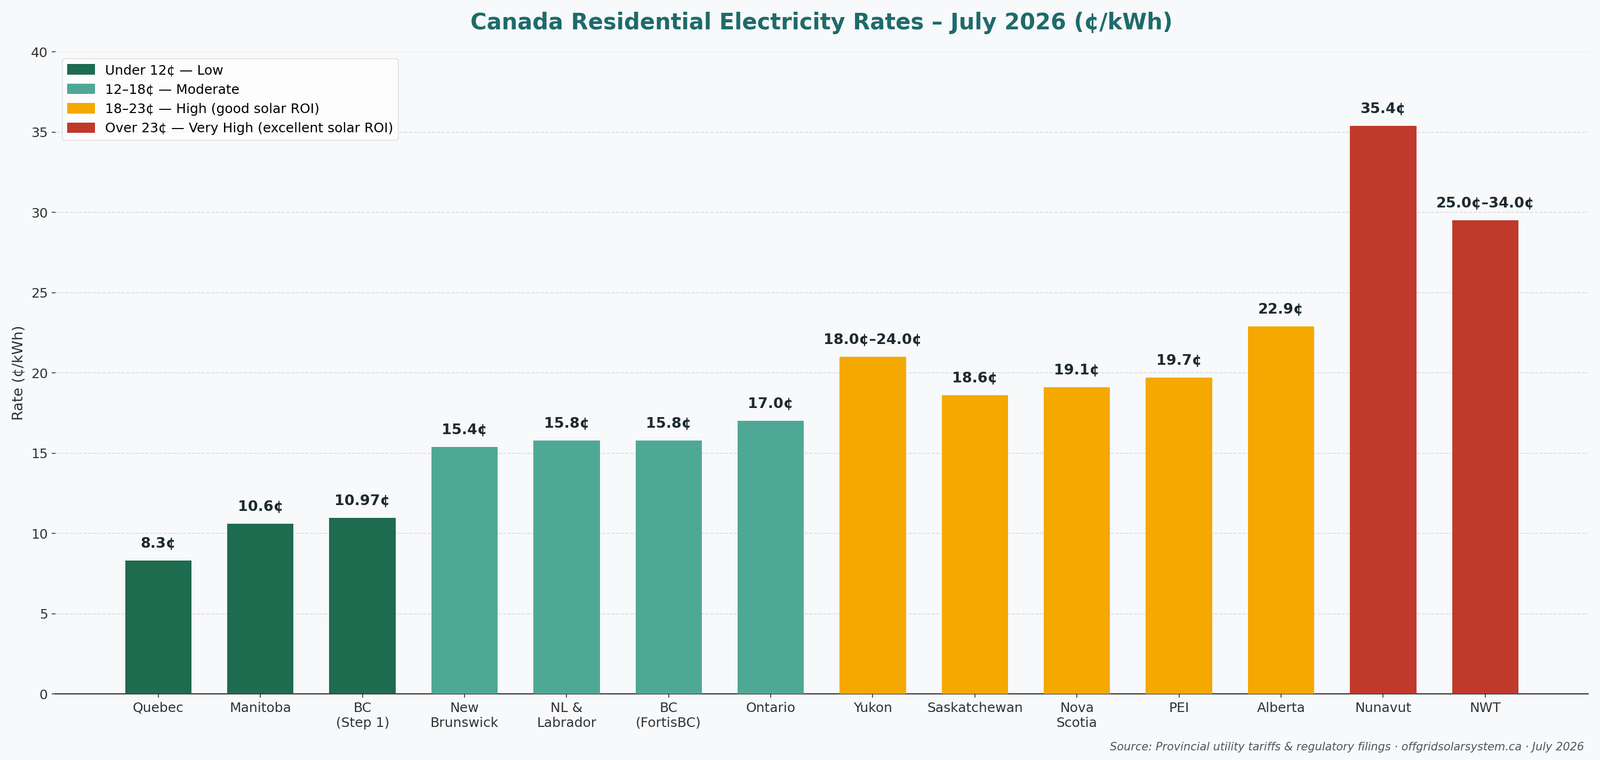
Average residential electricity rates across Canada (¢/kWh) - Updated July 2026
💡 Cheapest Province
Quebec – 8.3¢/kWh. Abundant hydroelectricity keeps prices remarkably low. Monthly bill for 1,000 kWh: $83.
🔥 Most Expensive Territory
Northwest Territories – 25.0¢–34.0¢/kWh. Diesel/hydro mix in remote communities, after territorial subsidy. Monthly bill for 1,000 kWh: roughly $250–$340.
⚡ National Average
Canadian average: 14-16¢/kWh. Wide variation means location dramatically impacts solar economics.
🌟 Solar Sweet Spot
Provinces and territories with real-world effective rates above 18¢/kWh offer the most attractive solar payback periods (typically 6-12 years).
📈 Rate Trends
Most regions experienced steady increases into 2026, with infrastructure overhauls and global fuel markets driving rates upward.
💰 Savings Potential
High-rate territories can save upwards of $45,000-$75,000 over 25 years with properly sized alternative solar systems.
Solar Savings Potential by Province
Higher electricity rates directly translate to greater solar energy savings. This table shows how solar power economics vary across Canada based on current electricity rates. Provinces with rates above 18¢/kWh see the fastest return on solar investments.
| Province/Territory | Rate (¢/kWh) | Solar Payback Period | 25-Year Savings* | ROI Rating |
|---|---|---|---|---|
| Northwest Territories | 25.0¢–34.0¢ | 7-9 years | $60,000+ | ⭐⭐⭐⭐⭐ Excellent |
| Yukon | 18.0¢–24.0¢ | 9-11 years | $28,000+ | ⭐⭐⭐⭐ Very Good |
| Nunavut | 35.4¢ | 7-9 years | $60,000+ | ⭐⭐⭐⭐⭐ Excellent |
| Alberta | 22.9¢ | 8-10 years | $35,000+ | ⭐⭐⭐⭐ Very Good |
| Saskatchewan | 18.6¢ | 9-12 years | $28,000+ | ⭐⭐⭐⭐ Very Good |
| Prince Edward Island | 19.7¢ | 10-12 years | $25,000+ | ⭐⭐⭐ Good |
| Nova Scotia | 19.1¢ | 10-13 years | $25,000+ | ⭐⭐⭐ Good |
| Newfoundland & Labrador | 15.8¢ | 12-15 years | $20,000+ | ⭐⭐ Moderate |
| Ontario | 17.0¢ | 12-15 years | $17,000+ | ⭐⭐ Moderate |
| New Brunswick | 15.4¢ | 12-15 years | $17,000+ | ⭐⭐ Moderate |
| British Columbia | 10.97¢ | 15-18 years | $12,000+ | ⭐ Fair |
| Manitoba | 10.6¢ | 18-22 years | $8,000+ | ⭐ Fair |
| Quebec | 8.3¢ | 20+ years | $5,000+ | Remote properties only |
*Savings estimates based on 10kW residential system, average provincial solar irradiance, and 3% annual electricity rate increases. Actual savings vary based on system size, energy consumption patterns, and local solar conditions.
💡 Quick Recommendation: Ready to lock in your solar savings? "Off Grid Solar Power Simplified" by Nick Seghers walks you through designing a complete system from scratch. If you want a plug-and-play solution right away, pair your knowledge with the reliable EcoFlow DELTA 2 Portable Power Station for seamless home backup.
As an Amazon Associate I earn from qualifying purchases.💰 Solar Investment Sweet Spot: Provinces and territories with rates above 18¢/kWh—including Alberta, Saskatchewan, Yukon, Prince Edward Island, Nova Scotia, Northwest Territories, and Nunavut—offer the most compelling solar ROI. These regions see payback periods under 10–12 years and lifetime savings exceeding $25,000 to $75,000.
Use our free calculators to go from your electricity bill to a complete off-grid solar system — panels, battery bank, charge controller, and wiring.
Estimated Monthly Electricity Bills (1,000 kWh Usage)
Based on all-in residential rates including energy charges, delivery costs, and fixed fees (before sales tax). These figures illustrate the dramatic cost differences across Canada and help estimate potential monthly savings from solar power systems.
| Province/Territory | Rate (¢/kWh) | Monthly Bill | Annual Cost | Difference vs. National Avg. |
|---|---|---|---|---|
| Quebec | 8.3¢ | $83 | $996 | -$67/month |
| Manitoba | 10.6¢ | $106 | $1,272 | -$44/month |
| British Columbia | 10.97¢ | $110 | $1,320 | -$40/month |
| Ontario | 17.0¢ | $170 | $2,040 | +$20/month |
| New Brunswick | 15.4¢ | $154 | $1,848 | +$4/month |
| Newfoundland & Labrador | 15.8¢ | $158 | $1,896 | +$8/month |
| Nova Scotia | 19.1¢ | $191 | $2,292 | +$41/month |
| Prince Edward Island | 19.7¢ | $197 | $2,364 | +$47/month |
| Saskatchewan | 18.6¢ | $186 | $2,232 | +$36/month |
| Alberta | 22.9¢ | $229 | $2,748 | +$79/month |
| Yukon | 18.0¢–24.0¢ | $180–$240 | $2,160–$2,880 | +$30 to +$90/month |
| Nunavut | 35.4¢ | $354 | $4,248 | +$204/month |
| Northwest Territories | 25.0¢–34.0¢ | $250–$340 | $3,000–$4,080 | +$100 to +$190/month |
Key Insight: A household in Northwest Territories or Nunavut can face out-of-pocket energy expenses $170–$270+ more per month than a matching home in Quebec. This substantial gap makes alternative energy investments especially attractive across northern regions.
Electricity Rate Trends (2020-2026)
Understanding rate trends helps predict future solar savings potential and informs investment decisions. Most Canadian provinces have experienced steady rate increases over the past six years, making solar power increasingly economically attractive.
📈 Fastest Growing Rates
Alberta & Saskatchewan: 4-6% annual increases due to market deregulation, infrastructure investments, and transition away from coal generation.
📊 Moderate Growth
Atlantic Provinces: 3-5% annual increases driven by aging infrastructure replacement, storm damage repairs, and fuel cost volatility.
📉 Below-Inflation Growth
Ontario: 1-3% annual increases with government subsidies and Ontario Electricity Rebate moderating rate growth.
🔒 Most Stable
Quebec & Manitoba: Sub-inflation rate increases (1-2% annually) thanks to abundant hydroelectric resources and public utility structure.
⛽ Northern Territories
High Volatility: Rates fluctuate with localized diesel operational overhead, subsidy program changes, and periodic General Rate Applications.
🔮 Future Outlook (2026-2030)
Industry experts predict steady upward adjustments Canada-wide through 2030, making locked-in solar generation assets increasingly valuable.
📊 Why Rates Are Rising:
- Infrastructure aging: Many provinces face $billions in grid upgrades
- Clean energy transition: Renewable energy investments increase near-term costs
- Carbon pricing: Federal carbon tax adds costs to fossil fuel generation
- Extreme weather: Climate change increasing storm damage and grid resilience costs
- Interest rates: Higher borrowing costs for utility infrastructure projects
Understanding Different Rate Structures
Residential electricity rates in Canada vary not only by province but also by how your bill is calculated. Understanding these structures helps predict both current costs and solar savings potential.
📊 Tiered Rates
How it works: Lower rate for first block of energy, higher rates for additional usage.
Solar benefit: ⭐⭐⭐⭐ Excellent - Solar reduces expensive upper-tier consumption.
Used in: BC, Quebec, PEI, Yukon
⏰ Time-of-Use (TOU)
How it works: Prices vary by time of day (peak vs. off-peak hours).
Solar benefit: ⭐⭐⭐⭐⭐ Excellent - Solar production peaks during expensive daytime hours.
Used in: Ontario
📏 Flat Rates
How it works: Same price per kWh regardless of usage or timing.
Solar benefit: ⭐⭐⭐ Moderate - Predictable savings but no peak-hour advantage.
Used in: Atlantic Canada, Northern Territories (isolated grids)
💹 Market-Based Pricing
How it works: Prices fluctuate with wholesale electricity market conditions.
Solar benefit: ⭐⭐⭐⭐ Variable - Excellent during high-price periods, protects from spikes.
Used in: Alberta
💡 Quick Recommendation: To optimize your home around complex rate structures, try pairing the ecobee Smart Thermostat Premium (featuring a smart sensor and built-in air quality monitor to intelligently manage climate control) with an Emporia Vue Smart Home Energy Monitor with 8 50A Circuit Level Sensors for real-time, granular tracking of your individual breaker circuits and solar generation.
As an Amazon Associate I earn from qualifying purchases.Rate Design Impact on Solar Savings
Different rate structures create varying opportunities for solar savings:
🏆 Most Solar-Friendly Rate Designs:
- ✅ Low fixed monthly fees (under $15) - more of your bill is offset by solar
- ✅ High volumetric charges (energy-based pricing) - bigger savings per kWh
- ✅ Strong net metering programs - full credit for excess solar production
- ✅ Time-of-use rates - solar generates during expensive peak hours
- ✅ Tiered rates with high upper tiers - solar eliminates expensive consumption
⚠️ Solar-Challenging Designs:
- ❌ High fixed monthly fees (over $30) - fees can't be offset by solar
- ❌ Declining block rates - cheaper per kWh for higher usage (rare in Canada)
- ❌ Limited or no net metering - excess solar goes to waste
- ❌ Demand charges - penalize peak power usage (uncommon for residential)
Frequently Asked Questions
Which Canadian province has the cheapest electricity rates?
Quebec has the cheapest residential electricity rates in Canada at approximately 8.3¢/kWh, thanks to abundant hydroelectric resources from massive dam projects and a public utility structure (Hydro-Québec). Manitoba is second-cheapest at 10.6¢/kWh, also benefiting from extensive hydroelectric generation through Manitoba Hydro.
Which Canadian province has the most expensive electricity?
Northwest Territories has the highest electricity rates in Canada, with published residential rates typically running 25.0¢–34.0¢/kWh depending on zone and season (before a territorial subsidy that applies to the first block of monthly usage). Nunavut follows at approximately 35.4¢/kWh. Yukon, which is mostly hydro-powered, runs lower at roughly 18.0¢–24.0¢/kWh. Among the provinces, Alberta has the highest typical residential rate at around 22.9¢/kWh due to its market-driven design.
What are the average electricity rates in Canada?
The national average residential electricity rate in Canada is approximately 14-16¢/kWh, weighted toward the country's large, low-rate provinces (Quebec, Ontario, BC). Individual rates span a wide range—from 8.3¢/kWh in Quebec up to roughly 34.0¢/kWh in Northwest Territories.
Why are electricity rates so high in the northern territories?
Northern territories rely heavily on complex regional logistics and diesel generation frameworks across remote communities. Moving fuel thousands of kilometers over ice roads or during a short summer sealift inflates basic generation costs immensely. Small population densities also mean foundational grid maintenance costs are split among fewer payers. Nunavut and Northwest Territories both apply consumer subsidy programs to offset a portion of this cost for the first block of monthly usage; Yukon avoids the worst of this because most of its supply comes from regional hydro.
How do electricity rates affect solar payback periods?
Higher electricity rates directly and proportionally reduce solar payback periods. Regions carrying true effective costs above 18¢/kWh typically yield fast solar return milestones of 6-12 years. In low-cost public hydro models like Quebec (8.3¢), grid-tied residential payback timelines expand past 20+ years, making installations primarily sensible for localized off-grid cabins or remote infrastructure setups.
Are electricity rates expected to increase in Canada?
Yes, structural grid modernization, carbon reduction targets, extreme weather repair overheads, and high public utility borrowing rates have resulted in standard annual increases of 3-6% across most jurisdictions. This structural inflation trend makes fixing your long-term energy generation costs via solar assets increasingly lucrative.
How can I reduce my electricity bill in Canada?
The most effective long-term solution is installing solar panels, especially in provinces with rates above 15¢/kWh. Other strategies include: energy efficiency improvements (LED lighting, efficient appliances), home insulation and air sealing, programmable thermostats, time-of-use optimization (in Ontario), heat pumps for heating/cooling, and energy monitoring to identify waste. Solar provides the largest long-term savings—often $15,000-$75,000 over 25 years depending on your province.
Does solar make sense in low-rate provinces like Quebec or Manitoba?
In provinces with rates under 11¢/kWh, grid-tied solar has long payback loops, meaning it is most practical for off-grid properties dodging massive utility line extension quotes. However, residential clients still build solar if optimizing specific solar-ready roof designs, leveraging federal grants, or protecting systems from potential rural micro-grid outages.
What's included in my electricity rate?
Your total billing weight incorporates **volumetric energy charges** (kWh usage metrics), **delivery/distribution infrastructure fees**, **high-voltage transmission grid scaling**, and **fixed regulatory service items**. The metrics inside this guide map standard fully blended user baselines but exclude local sales taxes (GST/HST/PST).
How much can I save with solar panels in my province?
Savings depend on your electricity rate, system size, and energy consumption. High-rate provinces offer the best returns:
- Northwest Territories (25¢–34¢) & Nunavut (~35¢): $45,000 to $60,000+ over 25 years
- Alberta (22.9¢): $35,000+ over 25 years (10kW system)
- Saskatchewan (18.6¢): $29,000+ over 25 years
- Atlantic Provinces (18.3-19.7¢): $25,000+ over 25 years
- Ontario (17.0¢): $17,000+ over 25 years
Use our solar savings calculator for a personalized estimate based on your specific situation.
What's the difference between regulated and deregulated electricity markets?
Regulated markets (most of Canada): Government-approved utility companies set rates with oversight from provincial regulators. Rates are stable and predictable but may not reflect real-time supply/demand. Deregulated markets (Alberta, parts of Ontario): Consumers can choose electricity retailers with market-based pricing. Rates fluctuate with supply/demand, offering potential savings but also price volatility. Alberta's deregulation has resulted in higher average rates but also more options for consumers.
💡 Quick Recommendation: Still have questions about starting your setup? Pick up Nick Seghers' highly-rated guide "Off Grid Solar Power Simplified" to learn the ropes. When you're ready to get hands-on, the Renogy 200W Monocrystalline Solar Starter Kit is widely considered the best beginner-friendly entry point into DIY solar generation.
As an Amazon Associate I earn from qualifying purchases.Planning Your Off-Grid Battery System?
Now that you understand electricity rates across Canada, the next critical step is sizing your battery bank and solar system correctly. Your province's electricity rate directly impacts system design decisions and ROI calculations.
Why Electricity Rates Matter for System Design
Understanding battery capacity is essential for determining backup power needs, calculating total system costs, and comparing battery specifications. Higher electricity rates translate to faster payback periods on solar + battery systems.
High-Rate Regions See Fastest ROI:
- Northwest Territories (25.0¢–34.0¢/kWh) – Systems pay for themselves in 7-9 years
- Yukon Territory (18.0¢–24.0¢/kWh) – Off-grid setups reach 9-11 year parity
- Alberta (22.9¢/kWh) – Off-grid systems achieve payback in 8-10 years
- Nova Scotia (19.1¢) & PEI (19.7¢) – Attractive 10-12 year payback
- Saskatchewan (18.6¢/kWh) – 9-12 year payback with excellent summer production
In contrast, low-rate provinces like Quebec (8.3¢) or Manitoba (10.6¢) see 15-20+ year paybacks, making off-grid systems more suitable for remote properties without grid access.
Related Off-Grid Solar Planning Tools
Size your array by monthly kWh bill or appliance load — for your province 💰 Solar Cost & ROI Calculator
Calculate payback period and lifetime savings at your electricity rate 🔋 Battery Runtime Calculator
Calculate how long your batteries will power your home 🔌 Charge Controller Sizing
Size your MPPT or PWM controller for your solar panel array ⚡ Watts to kWh Calculator
Calculate solar panel output in kWh for your province 🔌 Wire Sizing Calculator
Find the right AWG gauge for solar panels and battery cables ⚡ Solar vs Generator Calculator
Find the exact year solar beats your generator — with provincial fuel prices 🔋 Battery Chemistry Comparison
LFP vs AGM vs Lead-Acid — true 25-year cost per kWh with cold weather derating 💸 Off-Grid System Cost Guide
Component-by-component price breakdown for Canadian off-grid systems in 2026
💡 Solar ROI Sweet Spot: Regions with rates above 18¢/kWh—including Prince Edward Island (19.7¢), Nova Scotia (19.1¢), Yukon (18.0¢–24.0¢), Saskatchewan (18.6¢), Alberta (22.9¢), Northwest Territories (25.0¢–34.0¢), and Nunavut (35.4¢)—see the fastest ROI on off-grid solar architectures, frequently dropping below standard 10-year targets due to displacement of high local utility costs.
If high electricity rates in your province are driving you to consider off-grid solar, start with our Off-Grid Solar System Cost Guide for a complete component-by-component price breakdown — then use the Solar vs Generator Calculator to find out exactly when solar becomes cheaper than your current setup.
Methodology & Data Sources
Average provincial electricity prices were calculated using official utility tariffs and regulatory filings as of mid-2026. Monthly bill estimates assume 1,000 kWh of usage and include base energy charges, delivery costs, and standard fixed fees (before taxes or rebates). Solar savings calculations are based on typical 10kW residential system performance and current net metering policies.
Calculation Methodology:
- Tiered, time-of-use, and flat rates modeled using utility-specific billing structures
- Provincial averages population-weighted by utility coverage area
- Only standard residential rate classes included (no special programs or subsidies)
- Solar payback estimates assume average provincial solar irradiance and 3% annual rate increases
- All rates verified against 2026 regulatory filings where available
- Northern territory rates reflect effective blended rates after applicable consumer subsidy programs (e.g., NWT's Territorial Power Support Program, Nunavut's Electricity Subsidy Program)
Data Sources by Region:
Western Canada: BC Hydro, FortisBC, Alberta Utilities Commission, ENMAX, EPCOR, ATCO, SaskPower, Manitoba Hydro
Central Canada: Ontario Energy Board, Hydro-Québec Rate D
Atlantic Canada: NB Power, Nova Scotia Power, Maritime Electric, Newfoundland Power, NL Hydro
Northern Territories: Yukon Energy, ATCO Electric Yukon, Northwest Territories Power Corporation, Qulliq Energy Corporation
For detailed source links and utility-specific rate schedules, see the original article or contact your local utility directly. All data represents published residential rates as of July 1, 2026.